12 July July USDA Supply & Demand July 12, 2022 By John Roach USDA Supply/Demand 0 USDA numbers slightly larger than expected
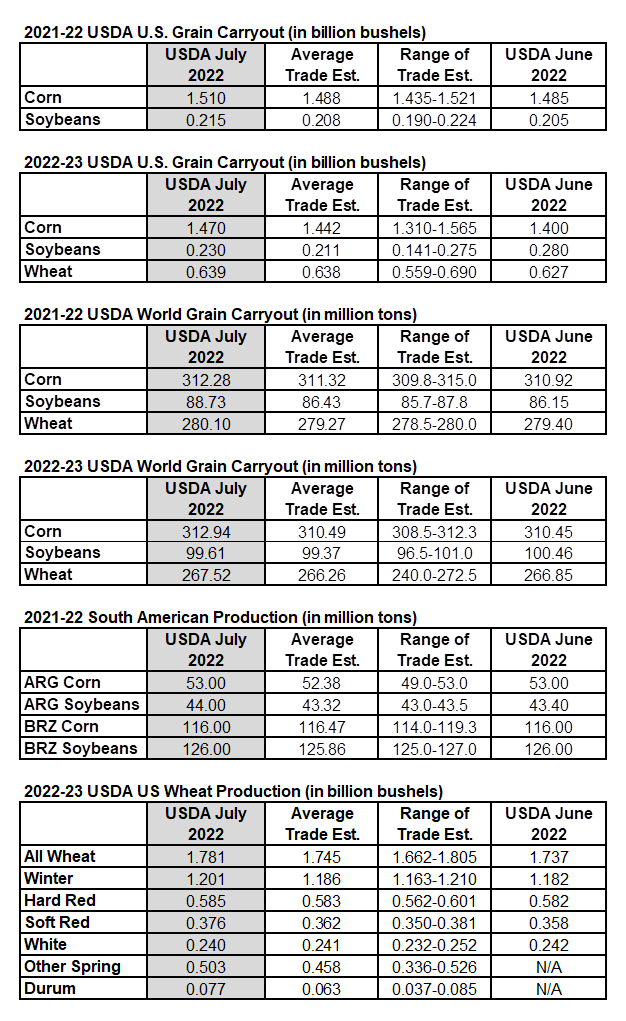
 All the key USDA numbers from today’s reports were in line with the average trade estimate. However, each estimate, except for Brazilian corn, was slightly larger than trade expected. But none of the larger estimates were big enough to allow for production cuts due to weather. Soybean new crop ending stocks fell 50 million bushels to 230 million bushels, due to the June 30 smaller acreage estimate. The number was still 19 million above trade expectations. The USDA did not change their corn or bean yield estimates this month. The only change the USDA made to their South American production estimates was in Argentine soybeans, where they increased their estimate slightly. There was nothing in the reports to excite traders. Markets have been unable to get up to the green line 20-day moving average this week. This promises to bring more technical selling. Related Posts July 2021 USDA Supply & Demand and Crop Production July USDA Supply & Demand and Crop Production: The biggest USDA surprise is smaller wheat carry out. Notice the corn and bean yield estimates released today are unchanged from June. US wheat production came in at 1.746 billion bushels, down 152 million bushels from last month. U.S. winter wheat production was increased by 55 million bushels, while the initial spring wheat estimate was 114 million bushels lower than the average trade estimate. The 2020-21 carryout in corn was reduced 25 million bushels from the last report, while beans were left unchanged. 2021-22 carryout was increased for corn by 75 million bushels. Soybeans were left unchanged. Wheat carryover was reduced by 105 million bushels. Bullish traders will be disappointed that the USDA did not give us a substantially tightened supply. But as you can see from the ending stocks graphs below, U.S. supplies are still relatively tight, with little room for new business. Our Buy Signals in corn and winter wheat have proven to be timely. Source: USDA, StoneX, Reuters The USDA estimates the spring wheat yield at 30.7 bushels per acre, ... January 2021 USDA Supply & Demand, Grain Stocks, and Winter Wheat Seedings January 2021 USDA Supply & Demand, Grain Stocks, and Winter Wheat Seedings: USDA tightens stocks The USDA reduced nearly all U.S. numbers below the average trade estimate. Supplies are smaller than traders thought, and markets surged. The biggest surprise in today’s estimates came in the corn market. The USDA reduced the U.S. 2020 corn yield by 3.8 bushels from their December estimate, taking it down 3.3 bushels from the average trade estimate. U.S. corn production was pegged at 14.182 billion bushels, down from 14.507 billion bushels in December. U.S. corn carryout was cut 150 million bushels, down to 1.552 billion bushels. The USDA also reduced the U.S. bean yield by 0.5 bushel/acre down to 50.2 bushels per acre, 0.3 bushels below trade estimates. That pulled U.S. bean production down 35 million bushels from the December estimate and 23 million below trade estimates. The USDA pegged U.S. soybean carryout at 140 million bushels down from the December estimate of 175 million bushels. This was one of a few estimates that were bigger than the trade expected, their guesses averaged 139 million bushels. U.S. wheat carryout ... September 2021 USDA Supply & Demand and Crop Production USDA numbers not as big as feared Crop prices initially broke lower following the USDA reports but found waiting buyers and were soon trading higher on the day, posting a reversal at this juncture. This might have been the low day of this price valley. The hurricane damage brought all the bears out of the woodwork, and they had already pressed prices down far enough. The USDA report pegged the national corn yield at 176.3 bushels per acre, up half a bushel from the average trade estimate and 1.7 bushel per acre higher than last month. The USDA forecast national corn production at 14.996 billion bushels, up about 150 million bushels from the average trade guess and 250 million bushels above last month. Corn ending stocks were estimated at 1.408 billion bushels on August 31, 2022. Some might want to make a big deal out of the carryover increasing over 1.4 billion bushels, but we expect demand to be larger than this latest USDA estimate, which was up 150 million bushels from last month. The USDA’s bean yield was 50.6 bushels ... May 2021 USDA Supply & Demand and Crop Production May 2021 USDA Supply & Demand and Crop Production: Old crop wheat and new crop corn stocks were both bigger than expected. Following the USDA reports today, wheat prices immediately slid lower. The corn market traded lower for a little bit but quickly began to recover. The bean market immediately recovered some small losses following the report. As you can see from the following table, wheat was the only crop that had a bigger carryout estimate for 2020-21 compared to trade estimates and last month’s estimates. The USDA old crop corn carryout estimate was slightly smaller than trade expected, while beans were right on target. For the first estimate of the 2021-22 new crop year, corn ending stocks at 1.507 billion bushels were larger than traders expected. New crop wheat carryout was also bigger than expected with beans right where the traders thought. The USDA barely changed 2021-21 world ending stocks for corn, beans, and wheat from their April estimates. That left today’s USDA world corn number considerably larger than traders expected. Beans and wheat were close to what was ... May USDA Supply & Demand The highly anticipated May USDA supply demand estimates contained a couple of surprises. First both old and new crop U.S. wheat carryout was smaller than trade expected. Second, the first USDA 2022-23 yield estimate was pegged at 177.0 bushels per acre, which was 4.0 bpa below the adjusted trend yield estimate in the February USDA Ag Outlook Forum. See the U.S. supply demand tables below. The rest of the key U.S. numbers were not far from trade estimates. Both old and new corn carryout were larger than expected. Despite the lower than expected 2022-23 corn yield, carryout increased on a 2.5% cut to domestic use and exports. The 2022-23 outlook for U.S. soybeans is for higher supplies, crush, exports, and ending stocks compared with 2021-22. The outlook for 2022/23 U.S. wheat is for reduced supplies, exports, domestic use stocks, and higher prices. The 2022-23 world carryout for corn and soybeans were larger than expected, while world wheat carryout was smaller than expected. In South America, the USDA left their April estimates for Brazilian corn and bean production unchanged while they lowered their ... September USDA Supply & Demand USDA soybean yield estimate smaller than expected at 50.5 bpa Soybeans The surprise in the USDA numbers came in a lower than expected US soybean yield estimate. The USDA cut their US soybean yield estimate from 51.9 bpa in August to 50.5 bpa in this month’s report. This was smaller than the low end of the trade estimate range. The USDA also cut the soybean harvested acreage estimate by 1% from last month, dropping it down to 86.6 million acres. This was 611,000 acres smaller than the average trade estimate. The reduced bean yield and acreage numbers put the estimate for total soybean production at 4.378 billion bushels, which is 153 million bushels below the August report and 118 million bushels below the average trade estimate. Crush (-20 million bushels) and export (-70 million) estimates were both reduced. Overall, this dropped the 2022-23 US soybean carryout to 200 million bushels, down from 245 million in August. The average trade estimate was for a slight increase in soybean carryout. The tighter supply numbers sent bean prices higher immediately after the report release. ... Comments are closed.