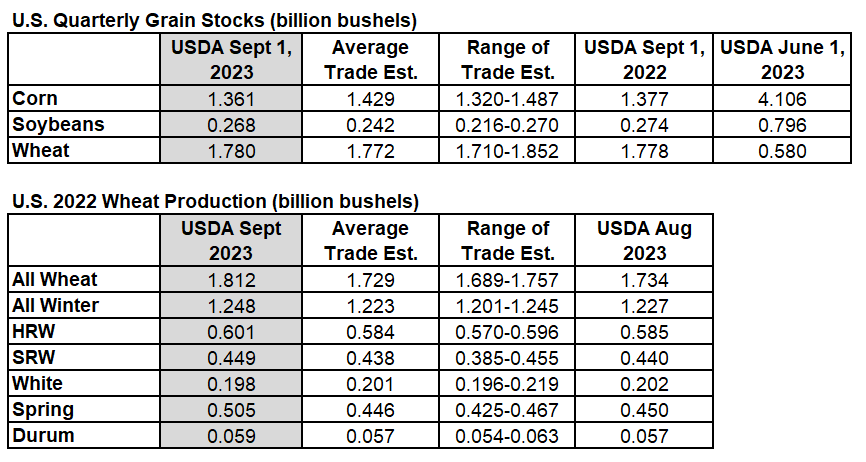
28 September September 2023 Quarterly Grain Stocks & Small Grains Summary September 28, 2023 By John Roach USDA Supply/Demand 0 More bean and wheat stocks than expected, less corn Corn Stocks Old crop corn stocks in all positions on September 1, 2023 totaled 1.36 billion bushels, down 1 percent from September 1, 2022. Of the total stocks, 605 million bushels are stored on farms, up 19 percent from a year earlier. Off-farm stocks, at 756 million bushels, are down 13 percent from a year ago. The June - August 2023 indicated disappearance is 2.75 billion bushels, compared with 2.97 billion bushels during the same period last year. Bean Stocks Old crop soybeans stored in all positions on September 1, 2023 totaled 268 million bushels, down 2 percent from September 1, 2022. Soybean stocks stored on farms totaled 72.0 million bushels, up 14 percent from a year ago. Off-farm stocks, at 196 million bushels, are down 7 percent from last September. Indicated disappearance for June - August 2023 totaled 528 million bushels, down 24 percent from the same period a year earlier. Comments Corn prices were down 7-8 cents following the reports, while beans and wheat both quickly dropped 20 cents. Corn was no longer in a Sell Signal once prices were down more than a couple cents. KC and Minneapolis wheat remain in Buy Signals, and Chicago wheat will likely join then on Monday unless prices recover by the end of the day. We remain concerned about the bean market and see multiple factors continuing to pressure price lower: The spec funds continue to liquidate their long positions. If the trend remains down, that will remain their normal pattern. The 26 million bushel larger than expected Stocks total today only accelerates this downward trend. If you are trend follower, it is hard to be long in this bean market. The fundamental risk is there is an abundance of global soybean supply. We are heading towards world ending stocks for soybeans being ample to burdensome. Sellers in South America will discount their prices to get their record productions sold and leave US sellers holding the bag. Our shipping costs are increasing. Low levels on both the Mississippi River and Panama Canal and driving US export costs higher. Rapidly advancing US harvest continues to exert pressure. Increasing political tension between US and China. If you want an indication of how that relationship is faring this week, China just said they want their panda bears back and they will no longer allow US zoos to display pandas. Small Grains Summary The big surprise from the USDA was a sharp increase in their 2023 US wheat production estimate. They increased their estimate by 78 million bushels to 1.812 million bushels, when trade expected a 5 million bushel decrease. Production estimates for all classes of wheat except White wheat exceeded trade expectations. Source: USDA, Bloomberg, StoneX Related Posts September Quarterly Grain Stocks & Small Grains Summary Corn stocks under the smallest trade estimate. Bean stocks larger than expected. Wheat exactly as expected. Source: StoneX, Reuters The smaller than expected corn stocks drove corn prices up through the 20-day moving average, with Friday’s high (at this writing) nearly reaching the September price peak. Technical traders will view today’s performance as a positive event as well as fundamental traders that have smaller beginning stocks for the crop year. Corn prices have been in a relatively narrow trading range during the month of September and Friday’s report could give us the price thrust up to a Sell Signal. Bigger supplies of soybeans to start the new crop year prevented beans from clearing the green line 20-day moving average Friday. Beans have been in a broad trading range since early August and next week, prices will be back down challenging support and adding days to our Buy Signal. There is a gap left on the November bean chart at $13.50, which will likely be a downside target for technical traders. The just finished wheat harvest was estimated to be smaller than the ... Sept 2021 USDA Quarterly Grain Stocks and Annual Small Grains Summary Reports More corn and beans, less wheat Stocks The USDA reported bigger corn and bean stocks than traders expected. As you can see from the numbers below, corn and wheat stocks were within the range of trade estimates, but the USDA found more beans than anybody expected. USDA Summary Based on an analysis of end-of-marketing year stock estimates, disappearance data for exports, and farm program administrative data, the 2020 corn for grain production is revised down 71.0 million bushels from the previous estimate. Corn silage production is revised down 54 thousand tons. Planted area is revised to 90.7 million acres, and area harvested for grain is revised to 82.3 million acres. Area harvested for silage is revised to .71 million acres. The 2020 grain yield, at 171.4 bushels per acre, is down 0.6 bushel from the previous estimate. The 2020 silage yield, at 20.5 tons per acre, remains unchanged from the previous estimate. A table with 2020 acreage, yield, and production estimates by States is included on pages 17 and 18 of the Stocks report. Soybean stocks stored on farms totaled 68.1 million bushels, down ... September 2024 Quarterly Grain Stocks & Small Grains Summary The USDA pegged Sept. 1 US corn stocks at 1.760 billion bushels, down from trade expectations of 1.844 billion bushels, but 400 bushels larger than last September 1. Soybean stocks were 342 million bushels, down from trade expectations of 351 million bushels, but 78 million bushels larger than last year. The USDA pegged all-wheat production in 2024 at 1.971 billion bushels. This was 5 million bushels more than trade expected and up 9% from 2023’s 1.80 billion bushel production. All winter wheat was 1.349 billion bushels, 1 million less than trade expected. HRW was 770 million, SRW was 372 million, Durum was 80 million, and WW was 236 million. Traders did not react strongly to the numbers. Corn moved about a nickel higher after the reports, while soybeans and wheat improved a couple cents. We have Sell Signals for corn and soybeans. Continue making sales. Source: USDA, Reuters June 2023 Acreage & Quarterly Grain Stocks Bean plantings fell well short of expectations, while corn plantings exceeded expectations. The biggest surprise in the USDA numbers came in soybean plantings. The USDA June planted acreage for beans came in 83.505 million acres, compared to the average trade guess of 87.673 million acres. The USDA bean acreage estimate fell 3.5 million acres below the lowest pre-report guess of 87 million acres. Corn acres were above the high of the pre-report estimates at 94.096 million acres. The high of the estimate range was 93 million acres. The average trade estimate of 91.853 million acres. An interesting trend in the data is that total principal crop planted acres in the western states ran above their previous estimates, while crops planted in the “I-states” were down from 0.75 – 1.1% from the prior estimates. The bigger corn acreage number indicates farmers were happy with their corn planting conditions and kept on planting. Corn stocks were down about 150 million bushels from the average trade guess. Bean stocks and wheat stocks were just slightly smaller than expected. Source: USDA/Reuters/StoneX March 2021 USDA Quarterly Grain Stocks and Prospective Plantings Farmers tell USDA, “We are not planting as many corn and bean acres as traders expected.” The quarterly stocks were slightly smaller than expected for corn and slightly larger on beans and wheat. No surprises in the Stocks report. Source: USDA, Reuters, StoneX Although corn acres are up less than 0.5%, four out of the top five states cut corn acres. Farmers decided to plant 5.4% more soybeans nationally and increased acres in each of the top five bean states. The surprise came in the wheat complex, where acreage was up 3.4% from the last estimate and a whopping 8.8% from last year. The bullishness in today’s reports is a little surprising, since acreage can certainly increase between now and the June report. By boosting the prices, traders will encourage the additional corn and bean acres the marketplace wants. How about the Buy Signals on soybeans, meal, and wheat this morning? Our strategy is to make an increment of sales on the next Sell Signal, which should be just around the corner. Source: All Slides from the USDA Executive Summary For full USDA reports, click on links below. Grain ... March 2022 USDA Quarterly Grain Stocks & Prospective Plantings USDA Stocks and plantings positive to wheat, Plantings positive to corn, negative to beans The USDA Quarterly Stocks report was not far off trade expectations for any of the crops. Corn and wheat stocks were both slightly lower, while bean stocks were slightly higher than the average trade guess. The biggest surprise came in Prospective Plantings. Farmers indicated they would plant 89.4 million acres of corn, 2.5 million acres less than traders thought. Farmers indicated 2.2 million more acres soybeans instead. After the aggressive market shakeout this week, the USDA report was released with many traders chased to the sidelines. Corn and wheat prices shot higher following the report, with July and December corn posting new life of contract highs. Bean prices initially fell following the reports but so far have held well above the low of this week’s range. Wheat prices surged higher and ended our Buy Signal in Chicago wheat. Wheat prices are still trading under the green line 20-day moving average, which is the next target for this upside move. The December corn acreage was reported 210,000 acres below ... Comments are closed.