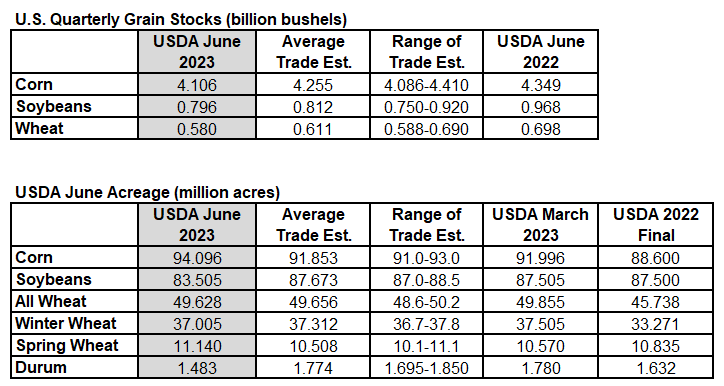
30 June June 2023 Acreage & Quarterly Grain Stocks June 30, 2023 By John Roach USDA Supply/Demand 0 Bean plantings fell well short of expectations, while corn plantings exceeded expectations. The biggest surprise in the USDA numbers came in soybean plantings. The USDA June planted acreage for beans came in 83.505 million acres, compared to the average trade guess of 87.673 million acres. The USDA bean acreage estimate fell 3.5 million acres below the lowest pre-report guess of 87 million acres. Corn acres were above the high of the pre-report estimates at 94.096 million acres. The high of the estimate range was 93 million acres. The average trade estimate of 91.853 million acres. An interesting trend in the data is that total principal crop planted acres in the western states ran above their previous estimates, while crops planted in the “I-states” were down from 0.75 – 1.1% from the prior estimates. The bigger corn acreage number indicates farmers were happy with their corn planting conditions and kept on planting. Corn stocks were down about 150 million bushels from the average trade guess. Bean stocks and wheat stocks were just slightly smaller than expected. Source: USDA/Reuters/StoneX Related Posts September 2023 Quarterly Grain Stocks & Small Grains Summary More bean and wheat stocks than expected, less corn Corn Stocks Old crop corn stocks in all positions on September 1, 2023 totaled 1.36 billion bushels, down 1 percent from September 1, 2022. Of the total stocks, 605 million bushels are stored on farms, up 19 percent from a year earlier. Off-farm stocks, at 756 million bushels, are down 13 percent from a year ago. The June - August 2023 indicated disappearance is 2.75 billion bushels, compared with 2.97 billion bushels during the same period last year. Bean Stocks Old crop soybeans stored in all positions on September 1, 2023 totaled 268 million bushels, down 2 percent from September 1, 2022. Soybean stocks stored on farms totaled 72.0 million bushels, up 14 percent from a year ago. Off-farm stocks, at 196 million bushels, are down 7 percent from last September. Indicated disappearance for June - August 2023 totaled 528 million bushels, down 24 percent from the same period a year earlier. Comments Corn prices were down 7-8 cents following the reports, while beans and wheat both quickly dropped 20 cents. Corn was no longer in ... June Acreage & Quarterly Grain Stocks USDA Surprises Traders with Fewer Bean Plantings The U.S. corn acreage was 40,000 acres less than expected, about half a million acres larger than the March intentions, but about 3.5 million acres smaller than last year’s final number. Beans had the most surprising number, coming in 2.1 million acres below expectations and 2.6 million acres below the March estimate. However, today’s bean planting estimate was still 1.1 million acres larger than last year’s final number. Wheat plantings were 75,000 acres larger than trade expected and 259,000 acres smaller than the March estimate, but 389,000 acres larger than last year’s final number. U.S. corn stocks were almost exactly what the trade expected and totaled 235 million bushels larger than last year at this time. Bean stocks were 5 million bushels larger than the trade expected and totaled 202 million bushels larger than last year. Wheat stocks were 5 million bushels larger than trade expectations and down 185 million bushels from last year. Markets will continue their focus on weather, with increased importance for beans. Source: USDA, Reuters September Quarterly Grain Stocks & Small Grains Summary Corn stocks under the smallest trade estimate. Bean stocks larger than expected. Wheat exactly as expected. Source: StoneX, Reuters The smaller than expected corn stocks drove corn prices up through the 20-day moving average, with Friday’s high (at this writing) nearly reaching the September price peak. Technical traders will view today’s performance as a positive event as well as fundamental traders that have smaller beginning stocks for the crop year. Corn prices have been in a relatively narrow trading range during the month of September and Friday’s report could give us the price thrust up to a Sell Signal. Bigger supplies of soybeans to start the new crop year prevented beans from clearing the green line 20-day moving average Friday. Beans have been in a broad trading range since early August and next week, prices will be back down challenging support and adding days to our Buy Signal. There is a gap left on the November bean chart at $13.50, which will likely be a downside target for technical traders. The just finished wheat harvest was estimated to be smaller than the ... June 2021 USDA Quarterly Grain Stocks and Acreage Farmers didn’t plant as many acres as traders wanted. Stocks slightly smaller than expected. We knew last fall that South America had to raise a bumper crop and that big crop needed to be followed by a U.S. bumper crop. South America did good on raising a record crop of soybeans, but their second crop corn continues to struggle and lose yield. U.S. farmers needed to make up for some of the world’s short supply by increasing acreage. The USDA told us in March that farmers were not planning on a big enough acreage increase. Today, the USDA confirmed that farmers did not plant as many acres as traders hoped they would. Now the market’s job is to continue to slow demand and adequately adjust for potential U.S. yield shortfalls. The market also needs to guard against potential U.S. weather worries, such as the drought in the western and northern Corn Belts and excess moisture in central and southern regions. This once again puts pressure on South America to strive to raise a record large crop next year. June 2024 Acreage & Quarterly Grain Stocks The USDA June quarterly stocks estimates were sharply higher than last year as expected but ended up even larger than the average trade estimates. However, they fell within the range of trade estimates. This was true for corn, soybeans, and wheat. The June acreage estimates were mixed compared to expectations. Corn acres came in at 91.475 million acres, which was 1.122 million acres larger than the average trade estimate and exceeded the highest trade estimate. This large total was obviously a bearish surprise to traders, as corn prices fell rapidly following the report. The USDA soybean acreage estimate swung in the opposite direction of corn. Bean acres were 653k smaller than the average trade estimate and fell below the smallest trade estimate. The smaller soybean acreage total tempered the impact of the larger than expected stocks number. Soybeans traded higher post-report. The wheat picture was also split, with larger than expected stocks, but smaller than expected acres. All wheat acres came in at 47.24 million acres, 417k smaller than the average trade estimate. Wheat prices slipped lower post-report. Source: USDA, Reuters, StoneX Sept 2021 USDA Quarterly Grain Stocks and Annual Small Grains Summary Reports More corn and beans, less wheat Stocks The USDA reported bigger corn and bean stocks than traders expected. As you can see from the numbers below, corn and wheat stocks were within the range of trade estimates, but the USDA found more beans than anybody expected. USDA Summary Based on an analysis of end-of-marketing year stock estimates, disappearance data for exports, and farm program administrative data, the 2020 corn for grain production is revised down 71.0 million bushels from the previous estimate. Corn silage production is revised down 54 thousand tons. Planted area is revised to 90.7 million acres, and area harvested for grain is revised to 82.3 million acres. Area harvested for silage is revised to .71 million acres. The 2020 grain yield, at 171.4 bushels per acre, is down 0.6 bushel from the previous estimate. The 2020 silage yield, at 20.5 tons per acre, remains unchanged from the previous estimate. A table with 2020 acreage, yield, and production estimates by States is included on pages 17 and 18 of the Stocks report. Soybean stocks stored on farms totaled 68.1 million bushels, down ... Comments are closed.